'Production Ready' Non-Negotiable: Performance Metrics
At RavenDB, I debugged a customer’s query that was taking several seconds to complete. The server-side processing was fast. But end-to-end, from the client’s perspective, the query was slow. Users were waiting.
The culprit wasn’t where you’d expect. It wasn’t the query engine or the storage layer. It was the network payload.
The Investigation: What Performance Metrics Reveal
I pulled the performance metrics first. The query itself was fast—executed efficiently, returned results quickly. Everything looked fine on the server side.
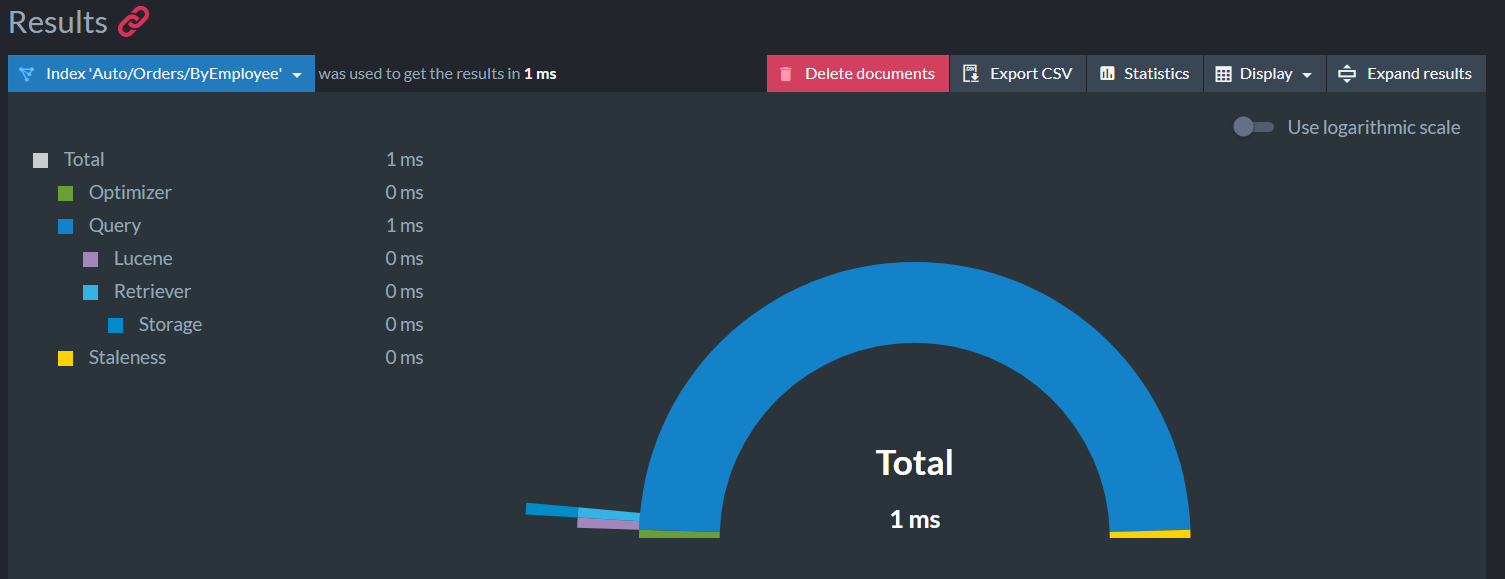
But the client was still waiting. So I opened Fiddler (RavenDB uses REST, so Fiddler works as a proxy) and looked at the actual response.
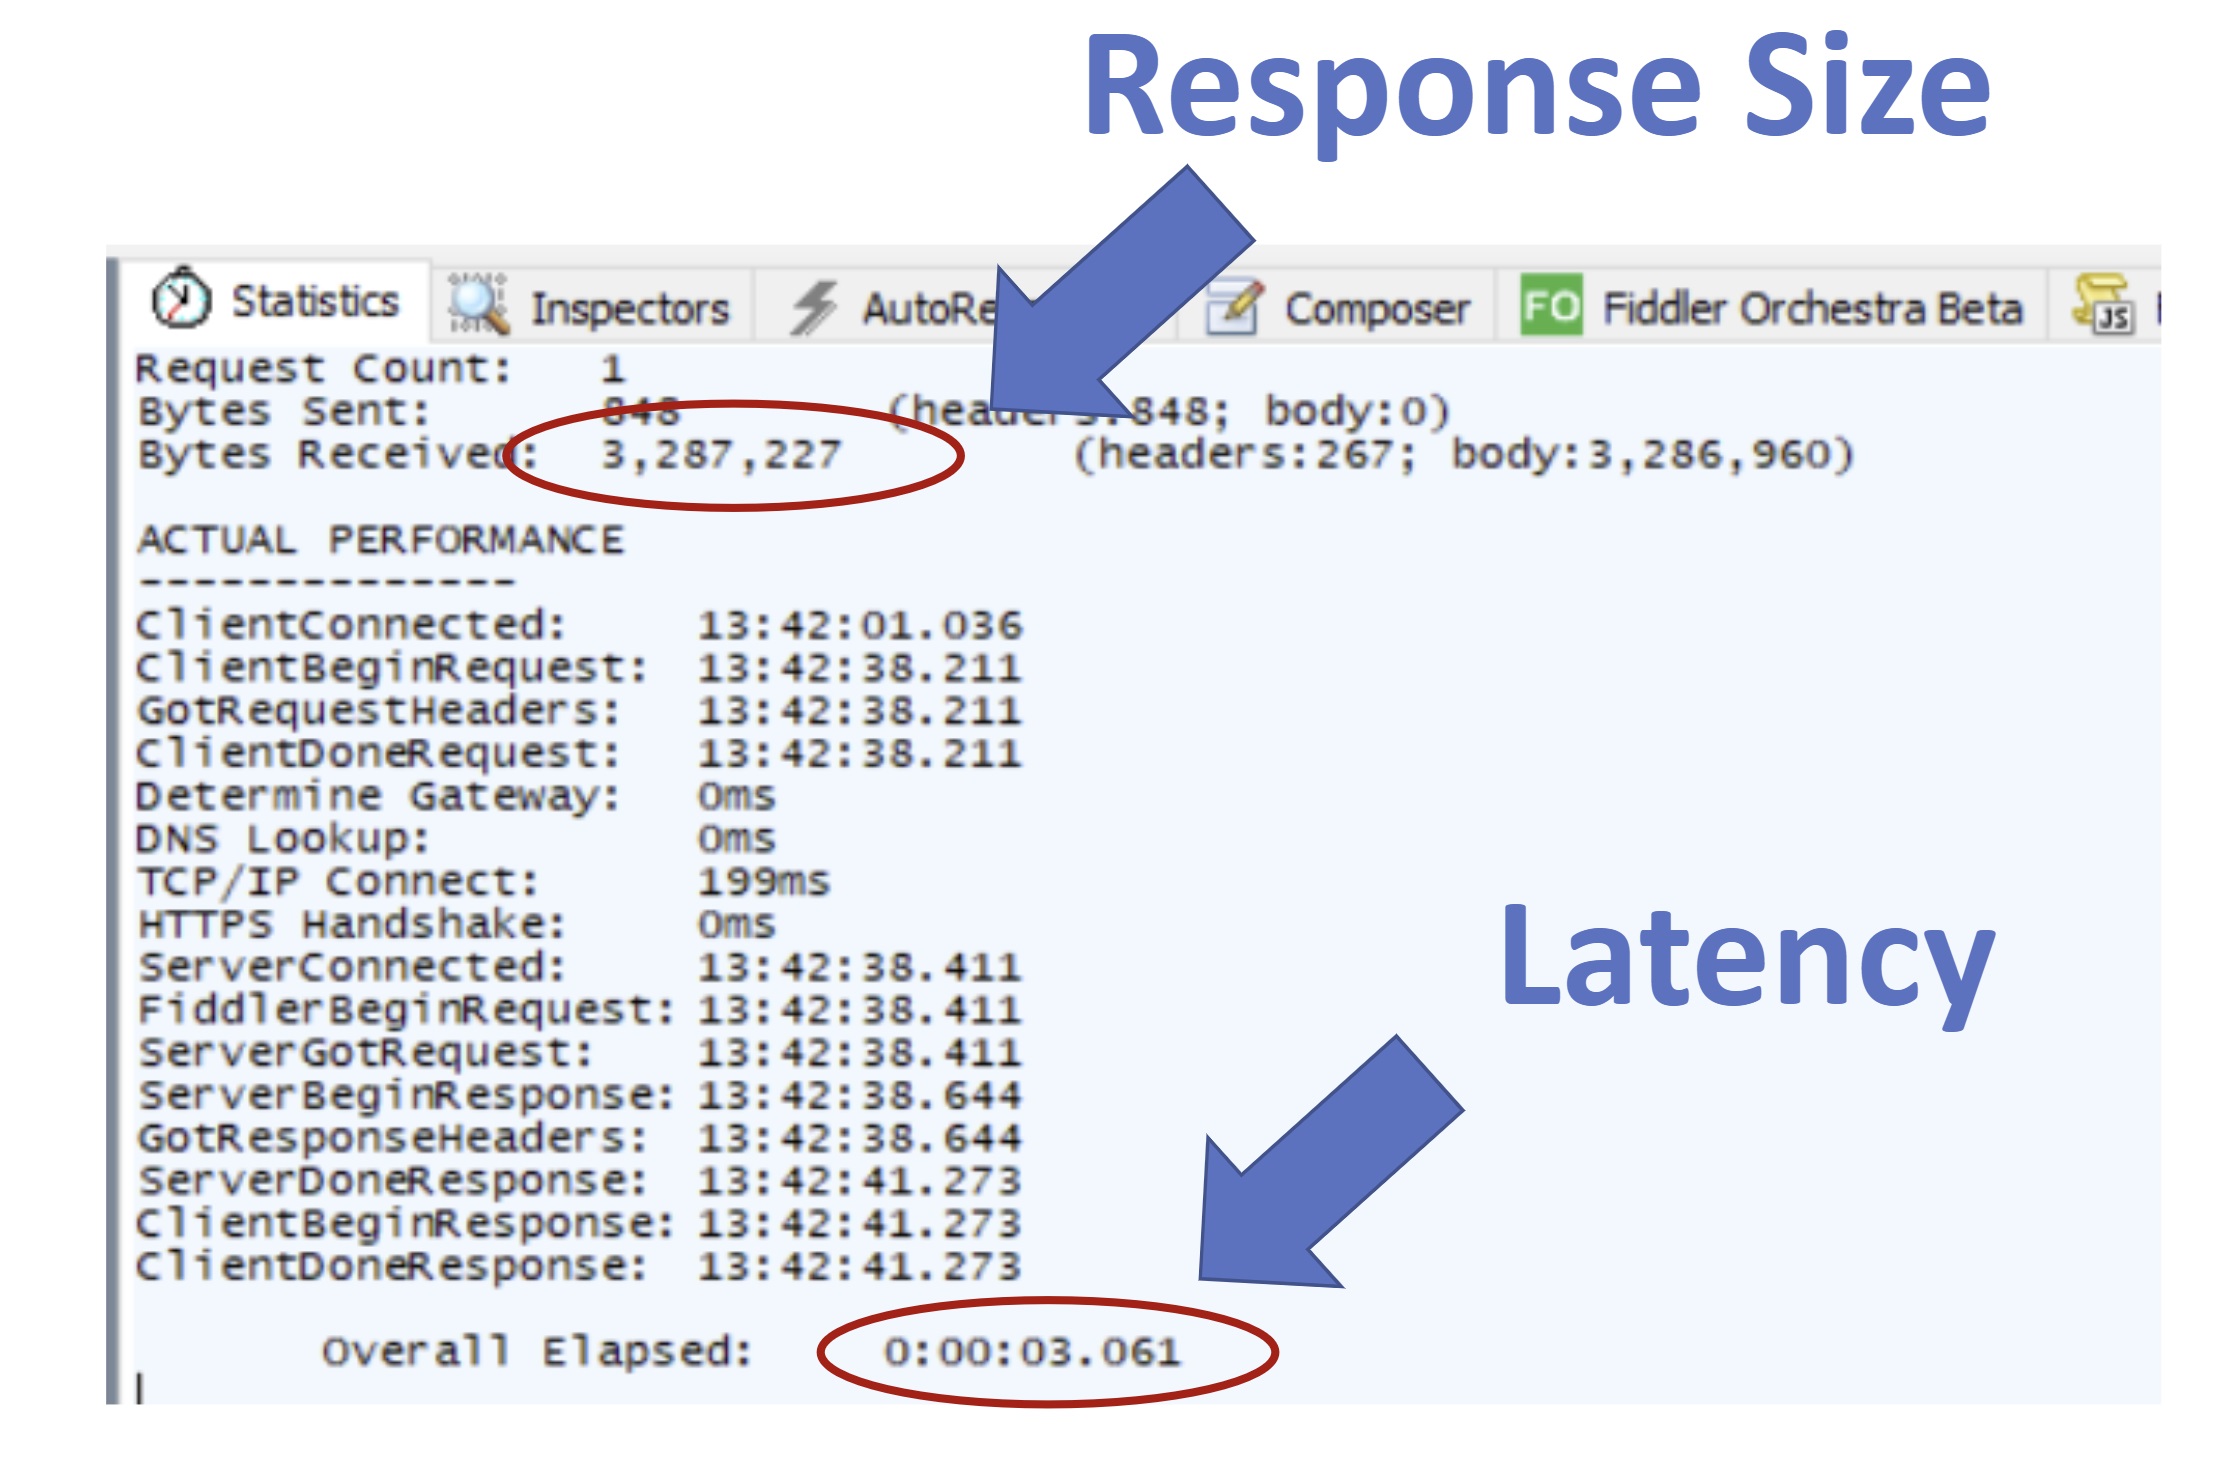
There it was: the query result was returning 100 documents, but the total payload was 3 megabytes. The customer’s query was pulling all 60 fields from each document when they only needed 2.
Without performance metrics, this would have been a guessing game. Trial and error. Disable this feature, enable that one, hope you stumble on the answer. Instead, the metrics showed exactly where the time was being spent.
The Fix and the Lesson
The solution was simple: add a projection to pull only the fields they needed. 2 fields instead of 60 per document. The latency dropped by over 90%.
But here’s the real lesson: performance metrics told us where to look, and why. Server-side metrics said “the query is fast.” Network-level metrics said “3MB is moving slowly.” Together, they painted a complete picture.
Why Performance Metrics Matter
Performance metrics do three things:
They show you where time is actually spent — Not where you think it’s spent. Server processing? Network? Disk I/O? Only metrics tell you for sure.
They give you historical data — Spotting a regression is easy when you can see “this endpoint was 50ms two weeks ago, now it’s 200ms.” Without history, you’re flying blind.
They save money — In cloud environments, data transfer costs money. Reducing a 3MB payload to 500KB by removing unnecessary fields isn’t just faster—it’s cheaper. That customer’s 90% latency improvement also meant 90% less bandwidth cost.
In that query case, performance metrics were the difference between “we don’t know what’s wrong” and “the answer is obvious.” That’s production-ready.
Performance Metrics vs. Monitoring
In the previous post, we talked about monitoring. They’re related but different.
Monitoring is your health dashboard. Is the server up? How much CPU? How much memory? It tells you if something is wrong.
Performance metrics are your optimization toolkit. How fast is this endpoint? How much data are we transferring? Where’s the latency bottleneck? They tell you what’s suboptimal and how to fix it.
Both matter. Monitoring catches crises. Performance metrics prevent them.
Series Roadmap
- 🔖 Introduction: Understanding Production-Ready Software
- 📈 Part 1: Structured Logging and Monitoring
- ⏳ Part 2: Performance Metrics: Ensuring Reliability Under Pressure - (You Are Here)
- 🧰 Part 3: Memory Dumps: Deciphering the Black Box
- 🧪 Part 4: Comprehensive Testing: From Unit to Integration
- 🛡️ Part 5: Beyond the Basics: Security, Scalability, and Documentation (Coming Soon)
What’s Next?
Next, we’ll explore memory dumps—your window into production problems when logs and metrics aren’t enough.